
Data Analyst Skills Canadian Employers Want, and How to Build Them
Nov 07, 2026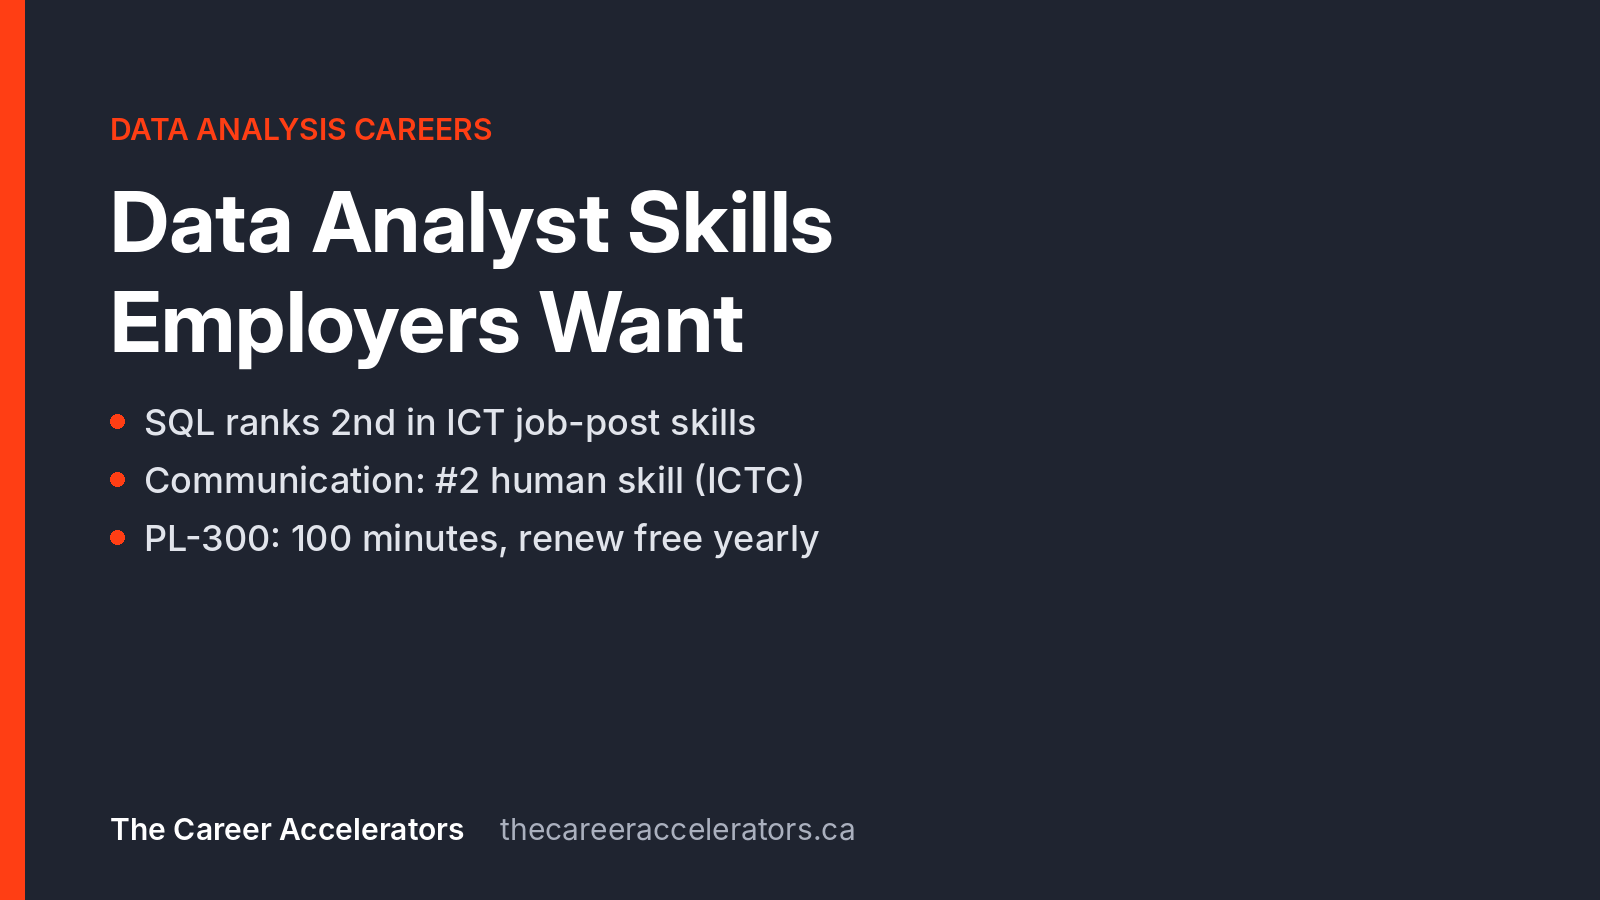
By Stephen Adindu, Lead Coach at The Career Accelerators. Last updated November 2026.
To get hired as a junior data analyst in Canada, you need two sets of skills: technical skills (SQL, Excel, Power BI or Tableau, data cleaning, basic statistics and simple data modelling, with Python or R as a bonus) and business skills (asking the right question, telling a clear story with data, working with stakeholders and knowing the industry). You don't need to be an expert in all of them, but you need to use each one on a real dataset and show proof.
Key takeaways
|
What skills do Canadian employers want in a data analyst?
Job Bank files data analysts under "data analyst - informatics and systems", part of database analysts and data administrators (NOC 21223). Its skills profile rates nine skills at a high level, including numeracy, digital literacy, oral comprehension, critical thinking and problem solving. Analytical thinking and attention to detail are the two personal attributes it marks as extremely important.
Job Bank doesn't name software; the Information and Communications Technology Council (ICTC) does. Its Digital Economy Pulse report (August 2025) analysed Vicinity Jobs postings for tech (ICT) occupations from December 2023 to December 2024. Microsoft Office Suite topped the technical skills, SQL tools came second, Python fourth and Power BI twelfth. The list covers all tech job posts, not only data analyst roles, so treat it as a guide. Among human skills, teamwork came first, communication second and attention to detail third.
ICTC counted 5,041 postings for database analysts and data administrators between November 2023 and November 2024, and recorded a 15.6% drop in postings over that period. The most common experience ask was 2 to 3 years across all sectors and 5 to 6 years in the tech sector itself, and ICTC notes that these roles generally ask for fewer years outside the tech sector.
What technical skills does a data analyst need?
Here are seven, roughly in order of importance.
1. SQL
Good enough for a junior role: you can filter, sort, group and aggregate; join three tables and explain why the row count changed; use CASE to sort records into categories; and break a long query into steps with subqueries or common table expressions.
Practise: install PostgreSQL, which is free and open source, and load a Canadian public dataset. Reproduce a total the publisher has already reported. If your numbers match, your joins work.
Prove it: a public GitHub repository of queries, each with its question and result.
2. Excel
Good enough: you can tidy a messy sheet, use lookups (XLOOKUP, or INDEX and MATCH), IF and SUMIFS, build pivot tables and charts, and use Power Query (called Get & Transform in Excel) to import data and shape it.
Practise: build a monthly report from raw data, then refresh it with the next month's data without retyping anything.
Prove it: the workbook in your portfolio. For a credential, there's Microsoft Office Specialist: Excel Expert (exam MO-211), booked through Certiport.
3. Power BI or Tableau
Learn one well first. For most job seekers, Power BI is the easier start: Microsoft's PL-300 certification tests it, and Power BI Desktop is free, though it runs on Windows only (Windows 10 or later). Tableau Public is free too, but everything you publish there is public.
Good enough: you can connect to data, clean it in Power Query, set up relationships between tables, write a handful of DAX measures (totals, CALCULATE, a year-over-year comparison) and build a two- or three-page report others can use without help.
Practise: turn your SQL project into a report, then watch a friend try to answer three questions with it.
Prove it: the report file and screenshots, plus the PL-300 (see below). For Tableau, a Tableau Public profile and the Salesforce Certified Tableau Data Analyst credential.
4. Data cleaning
Good enough: you can find and fix duplicates, blanks, wrong data types, inconsistent labels ("ON", "Ont." and "Ontario" in one column) and unusual values. You never overwrite the raw file, and you log every change.
Practise: swap files with a study partner. Each of you adds duplicates, blanks and typos to a clean public file, then cleans the other's.
Prove it: a cleaning log in each project: row counts before and after, and each rule you applied.
5. Basic statistics
Good enough: you know when the mean misleads and the median doesn't; you can describe spread (range, interquartile range, standard deviation); you can spot outliers; and you never present a correlation as a cause.
Practise: Statistics Canada's online guide Statistics: Power from Data! covers averages, spread, sampling and charts. After each chapter, work out the same measures on your own dataset.
Prove it: one sentence per project explaining a statistical choice, such as why you used the median.
6. Data modelling basics
Good enough: you can split data into fact tables (events, such as sales) and dimension tables (products, stores, dates), link them with keys and one-to-many relationships, and add a date table. Modelling is one of the PL-300's four skill areas.
Practise: split a flat file into one fact table and two or three dimension tables, relate them in Power BI, and check that your totals still match the original.
Prove it: a screenshot of the model diagram, with a sentence on your design.
7. Python or R (a plus)
Treat either as a bonus, and let the ads you're targeting decide which one to learn.
Good enough: in Python, you can load a CSV file with pandas, clean it, group it, merge it with another table and chart the result in a Jupyter notebook.
Practise and prove it: redo one SQL project in pandas, check you get the same answers, and post the notebook on GitHub.
What business skills does a data analyst need?
Microsoft's profile of the PL-300 candidate describes someone who works closely with business stakeholders and uses knowledge of the business to turn data into insight. In ICTC's interviews, employers valued staff who frame their ideas as answers to business problems, and rated clear spoken and written communication as highly significant "even for the most technical roles."
Asking the right question
Good enough: you can turn a vague request ("why are sales down?") into a specific question with a metric, a time frame and the decision it supports, and confirm it before you build anything.
Practise: before you open any dataset, write a short brief: the decision, the question, the metric, the data you need and what's out of scope.
Prove it: put the brief at the top of each project, so hiring managers see your thinking first.
Storytelling with data
Good enough: you lead with the answer, back it up with two or three clear charts, label everything, and end with what the reader should do next.
Practise: write a 150-word summary of every analysis for a manager who has two minutes. Then present it to someone non-technical in five minutes.
Prove it: a one-page summary and a short recorded walkthrough, linked from your portfolio.
Stakeholder communication
Good enough: you agree definitions before you start (what counts as an "active customer"?), explain a data limitation in plain words, say no politely, and give updates without being chased. Job Bank rates oral comprehension at a high level for this role and collaboration as highly important.
Practise: offer a small analysis to a non-profit, a community group or your current employer, and treat the conversations as the practice.
Prove it: a reference from the person you did the work for.
Domain knowledge
Good enough: you can name the main measures your target industry runs on and what tends to move them. In retail that might be sales per store and average basket size; in a hospital, wait times and bed occupancy.
If you're changing careers or are new to Canada, your previous industry is an asset: an accountant already understands financial data, a nurse patient flow. Since ICTC found these roles ask for fewer years of experience outside the tech sector, your old industry may be your most realistic first target.
Practise and prove it: list the measures employers in that industry report in their annual reports, and build your main project on that industry's data.
Data analyst skills checklist: are you junior-ready?
Tick a row only when you can do it on a dataset you haven't seen before, and you have the proof to show.
| Skill | You're junior-ready when you can | Proof to show |
|---|---|---|
| ☐ SQL | Join three tables, group and filter, and explain why a row count changed | Query repository |
| ☐ Excel | Build a refreshable report with Power Query, lookups and pivot tables | Workbook; MO-211 optional |
| ☐ Power BI or Tableau | Build a two- or three-page report a manager can use without help | Screenshots and file; PL-300 optional |
| ☐ Data cleaning | Fix duplicates, blanks, types and labels, and log each change | Cleaning log |
| ☐ Basic statistics | Choose between mean and median, describe spread and spot outliers | A statistics note in each write-up |
| ☐ Data modelling | Split a flat file into fact and dimension tables and relate them | Model diagram |
| ☐ Python or R (a plus) | Load, clean, group and chart a dataset in a notebook | Notebook on GitHub |
| ☐ Asking the right question | Turn a vague request into a measurable question | Project brief |
| ☐ Storytelling with data | Lead with the answer and support it with two or three clear charts | One-page summary |
| ☐ Stakeholder communication | Agree definitions and explain limits in plain words | Reference from a project |
| ☐ Domain knowledge | Name your target industry's main measures and what moves them | Portfolio project in that industry |
Which certification proves data analyst skills?
None is required: Job Bank has no information on certification requirements and says the occupation isn't regulated. But ICTC's June 2026 Digital Economy Pulse found employers treat post-secondary education as a baseline and look for extra proof, such as experience, certifications or micro-credentials. For Power BI, that proof is Microsoft Certified: Power BI Data Analyst Associate (exam PL-300).
The PL-300 is an intermediate-level exam of 100 minutes, and you need 700 or higher to pass. Microsoft sets the price by the country where you take it, renewal every 12 months is a free online assessment, and there's a free practice assessment to try first.
How can you build data analyst skills in 10 weeks?
This plan assumes about 8 to 10 hours a week. It covers the basics of every skill except Python or R, and weeks 7 to 10 build one portfolio project.
| Week 1: Excel Import a messy public dataset with Power Query; add lookups, a pivot table and a chart. Keep: a workbook that refreshes. |
| Week 2: SQL basics Load your data into PostgreSQL; practise SELECT, WHERE, ORDER BY, GROUP BY and HAVING. Keep: 15 questions answered with queries. |
| Week 3: SQL joins Join three tables, add CASE and a common table expression, and check row counts. Keep: a query repository on GitHub. |
| Week 4: Cleaning and statistics Fix duplicates, blanks, types and labels, then work out averages, spread and outliers. Keep: a cleaning log and a short note on the numbers. |
| Week 5: Power BI data and model Split a flat file into fact and dimension tables, set relationships and add a date table. Keep: a model whose totals match your SQL. |
| Week 6: Power BI measures and report Write DAX measures (totals, CALCULATE, year over year) and build two report pages with filters. Keep: a report a friend can use without help. |
| Week 7: The question and the industry Pick your target industry, list its main measures, write a project brief and find public data for it. Keep: the brief and the dataset. |
| Weeks 8 and 9: Build it and tell the story Clean, query and model the data, build the report, then write a 150-word summary and present it to someone non-technical. Fix whatever confused them. Keep: the final report and summary. |
| Week 10: Publish and test yourself Post the project on GitHub with its brief, cleaning log, model diagram and findings. Try the free PL-300 practice assessment. Keep: a portfolio link. |
For data, start with Statistics Canada, whose open licence lets you publish your own analysis of its data. When you do, credit it as "Adapted from Statistics Canada, [product name], [reference date]" and add a line saying this does not constitute an endorsement by Statistics Canada.
How we build data analyst skills at TCA
Our data analyst course, the Data Analysis Coaching Course, starts with an intensive four-day foundation training, delivered live online by practising senior data analysts, and adds 12 weeks of hands-on experience on a live project, where you analyse datasets, build visualizations and present insights.
This program covers SQL, Excel (pivot tables, data cleaning and formulas), Power BI and Tableau dashboards, ETL on Microsoft Azure and an introduction to Python. It includes preparation for the PL-300, one-on-one mentorship from senior data analysts, resume review, interview preparation and references based on your live project work. No prior IT experience is needed. The work experience on the live project is guaranteed; a job isn't.
Data analyst skills FAQs
What should I learn first, and do I need to code?
Start with SQL and Excel. SQL is a query language rather than full programming, so it's a gentler start than Python or R, which you can add later.
Can I learn data analyst skills for free?
Mostly. PostgreSQL, Power BI Desktop, Tableau Public and pandas are free. Certification exams such as the PL-300 aren't; the price depends on your country.
Do I need a degree to become a data analyst in Canada?
Job Bank says employers usually ask for a bachelor's degree or college program, usually in computer science, computer engineering or mathematics, plus programming and related experience. The occupation isn't regulated, though. Our data analyst career roadmap covers the routes in.
Do data analysts need AI skills?
Increasingly, yes. AI ranked sixth in ICTC's list of technical skills across all tech job posts, and Microsoft's current PL-300 outline includes using Copilot in Power BI to create report pages and summarise a data model. You still need SQL and statistics to check the AI's answers.
Stephen's tip: Write the business question at the top of every project before you open the data. If you can't say which decision your analysis supports, you're not ready to write a query.
Ready to build your data analyst skills?
Our data analyst course combines live online training in SQL, Excel, Power BI, Tableau and Python with a 12-week live project and PL-300 preparation. Not sure where to start? Book a free call and we'll look at which skills you already have.
Related reading: how to become a data analyst, the best data analytics bootcamps and courses for Canadians and 40 tech skills in demand in Canada.
Sources
- Job Bank: data analyst skills and knowledge (NOC 21223) and job requirements, for skill ratings, education and regulation
- ICTC Digital Economy Pulse: Productivity and Employment Trends (August 2025), for skills in tech job posts, posting counts, experience asks and employer interviews; Workforce Development (June 2026), for what employers count as extra proof
- Microsoft Learn: Power BI Data Analyst Associate, the PL-300 study guide, Get Power BI Desktop and exam MO-211, for exam facts and requirements
- Microsoft Support: Power Query in Excel, Tableau Public, Trailhead: Tableau Data Analyst, PostgreSQL, pandas and Jupyter, for the tools
- Statistics Canada: Statistics: Power from Data! and the Open Licence, for the statistics guide and reuse terms
- The Career Accelerators: Data Analysis Coaching Course, for our course details
